

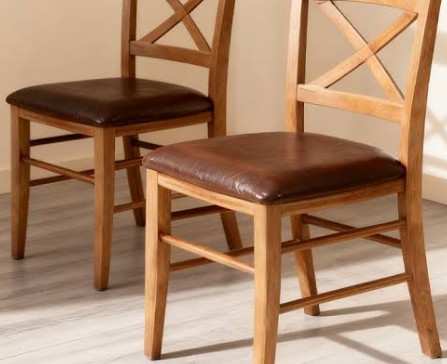
A hundred and twenty dollars a chair sounds like the number that matters, and it is the number every comparison gets built on. It is also the least informative figure available, because it describes one moment in a relationship that runs for a decade and involves several other payments nobody puts in the same column.
Working out what restaurant chairs actually cost per seat over ten years takes an afternoon with a spreadsheet and routinely reverses the ranking the quotes produced. The exercise is straightforward and simply unfamiliar, because furniture is bought the way consumables are bought and then expected to behave like an asset.
The First Number Is the Only One on the Quote
Start by separating what is quoted from what is spent.
The quote gives a unit price and, if you are lucky, a freight estimate. It does not give assembly labor, or the premium for assembled delivery, or disposal of what the chairs replace, or the cost of the days the room is not trading while the changeover happens.
Those are all first-year costs and none of them scales with the quality of the chair. They scale with how many times you do it, which is the point most operators miss. Buying twice in ten years means paying all of them twice.
The Depreciation Assumption Is a Useful Benchmark
There is a ready-made expectation about asset life sitting in the tax code, and it is worth borrowing as a sanity check.
Furniture and fixtures are treated as seven year property for depreciation. That is the working assumption about how long this kind of asset should serve before it is written off.
A chair that fails at year three is being run at less than half its assumed life. The accounting permits it. What it means operationally is that the replacement is coming out of operating cash rather than out of a planned capital cycle, and it will keep doing so.
Failure Rate Is the Variable That Dominates Everything
Run two options through ten years and one number decides the outcome.
A chair with an annual failure rate of two percent loses roughly a fifth of a hundred-seat room over a decade, replaced in small batches. A chair failing at eight percent loses the room twice over. The unit price difference between those two chairs is rarely more than thirty percent.
Small replacement orders are also disproportionately expensive. Freight on twelve chairs costs close to what freight on sixty costs, and the administrative time is identical. The failure rate therefore multiplies through several lines at once.
There is a second effect that never gets costed. A room replacing chairs in batches ends up holding two or three generations of the same model in visibly different condition, which reads as neglect no matter how clean the room is.
Repairability Splits the Field More Than Price Does
The second dominant variable is whether a failure is a repair or a replacement.
A chair with a field-replaceable glide, a bolt-through seat and available parts costs a few dollars and ten minutes when something goes. A chair with moulded-in glides and a bonded seat costs a whole chair for the same fault.
Ask three questions at the point of sale: which components can be replaced individually, whether those parts are stocked domestically, and what they cost. A supplier who answers all three is selling an asset. One who cannot is selling a consumable at asset prices.
The Labor Line Nobody Attributes to Furniture
There is an annual cost that never appears in a furniture budget and belongs there.
Chairs that stack badly, weigh too much or catch on each other add seconds to every reset, every clean and every reconfiguration. Across a hundred-seat room, two services a day, three hundred days a year, seconds become hours and hours become a real payroll number.
The Bureau of Labor Statistics tracks a large and persistently hard-to-staff food preparation and serving workforce. In that environment, time saved on resets is worth more than it was a decade ago, and it compounds every year the chair stays in service.
What Testing Actually Tells You About Year Five
The one piece of evidence that predicts failure rate is available and rarely requested.
Contract seating tested against the standards published by BIFMA has been through cyclic load, drop and stability testing built to compress years of use into a laboratory sequence. It does not guarantee a service life and it does separate products that were engineered from products that were styled.
The relevant question on a quote is not whether the chair is described as commercial. It is whether the supplier can produce a test report number, which takes one email and costs nothing.
Building the Ten Year Number
For an operator who wants the real figure rather than the quoted one:
- Year one: unit price, freight, assembly, disposal, and days not trading
- Annual: expected failure rate multiplied by seat count, at small-order freight
- Annual: repair parts consumed, at stocked prices rather than estimates
- Annual: reset and cleaning minutes attributable to the chair, costed at payroll
- Year ten: residual condition, and whether the room needs replacing wholesale
What the Spreadsheet Usually Says
Two results come up again and again when operators run this properly.
The first is that the cheap chair and the well-specified chair land much closer together than the quotes suggested, and often in the reverse order. The second is that the biggest single swing turns out to be model continuity rather than price or even durability. A discontinued line turns every future failure into a decision about the whole room rather than about one chair.
Neither of those is visible from a purchase price, which is the argument for not making the decision from one. The chair that was cheapest on the day is very rarely the chair that was cheapest by the time the lease came up for renewal. The gap is usually large enough to have funded something the room actually needed.

